20 February 2014
Using Linux perf for great CPU stats and seeing system performance
The perf command is a really good low-level Linux profiling tool.
You can use it to profile your programs ...
$ perf stat conv

 Performance counter stats for 'conv':

         18.600269 task-clock                #    0.970 CPUs utilized
                13 context-switches          #    0.001 M/sec
                 8 CPU-migrations            #    0.000 M/sec
              1621 page-faults               #    0.087 M/sec
          34604515 cycles                    #    1.860 GHz                     [35.87%]
           3070113 stalled-cycles-frontend   #    8.87% frontend cycles idle    [28.97%]
           2557127 stalled-cycles-backend    #    7.39% backend  cycles idle
          10234506 instructions              #    0.30  insns per cycle
                                             #    0.30  stalled cycles per insn [96.18%]
           3765521 branches                  #  202.444 M/sec                   [75.68%]
            159957 branch-misses             #    4.25% of all branches         [54.80%]

       0.019182090 seconds time elapsed
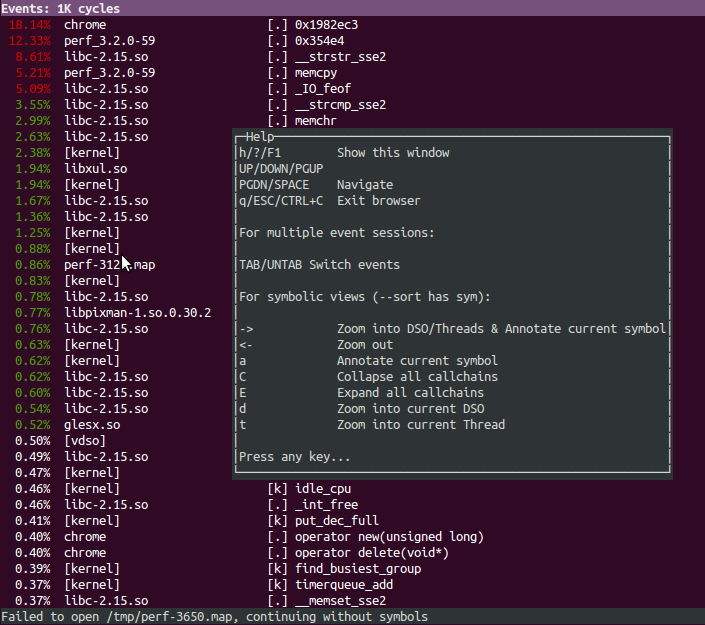
But you can use it to profile the running system and then for example query who caused certain kernel lock events with the interaction "perf top" tool....
https://perf.wiki.kernel.org/index.php/Main_Page
https://access.redhat.com/site/documentation/en-US/Red_Hat_Enterprise_Linux/6/html/Developer_Guide/perf-using.html
Subscribe to:
Comments (Atom)